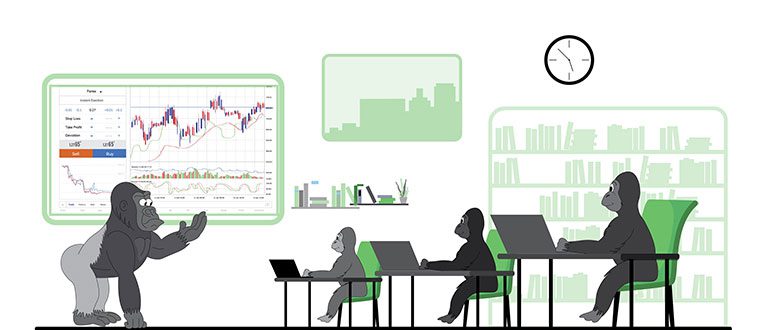
Price Action Forex Trading Strategy
Forex trading – also known as FX trading or Foreign Exchange trading – refers to the conversion of one currency to another.
In fact, although currency exchange also takes place for more directly practical purposes, the vast majority of currency conversions that happen across the world are initiated by Forex traders, who are working with the primary aim of making a profit.
You’ve recently been taking steps to learn Forex trading best practices, learning everything you can about different trading options, and are ready to throw yourself into the world of finance headfirst with the best Forex trading strategy at your disposal. However, there’s always something new to learn and implement in your trading strategy.
Within the realm of Forex trading and Forex trading strategy, you’ve likely come across the term “Price Action Forex Trading”. However, do you know what Price Action Forex trading is and what strategies you might want to look into or implement? Read on to learn more about this trading strategy and how it can help you.

What is Price Action Trading, Anyway?
In the world of Forex, any movement that happens with regard to price occurs as a result of the dynamics between buyers and sellers. When GBP/USD moves up, for example, it is because there are more buyers than sellers interested in the pairing. On the other hand, when GBP/USD moves down, it is because there are more sellers than buyers for that pairing.
Price Action trading is essentially about analysing who is currently in control of the price – whether the buyers or sellers – as well as trying to determine, as accurately as possible, whether they are likely to remain in control.
With the right insights, a good Price Action Forex trading strategy can allow individuals to benefit significantly from the current state of the market, while simultaneously reducing risks to their portfolio.
If an analysis of the market shows that bulls are currently in control and are likely to remain in control of price, this is a good time to buy. If, on the other hand, bears are currently in control and seem likely to remain in control, this is an indicator to sell.
How to Analyse and Determine Who is in Control?
So, determining whether bulls or bears are currently controlling prices in the Forex market is very important. But how does one go about actually determining who is in control of price at any given time? There are two basic price action techniques that come into play here.
Monitoring Support and Resistance Areas
One strategy you may want to consider is monitoring the support and resistance areas. This involves keeping a close eye on key areas where buying and selling occur. This will allow you to closely and effectively monitor what is happening in the market in real-time. Monitoring support and resistance areas can help you time your trading effectively to help you maximize your profits.
The basic premise of this strategy is that when price changes impact one area of the market, they are likely to directly impact other areas of the market, as well. While this is by no means a foolproof strategy, it can help you time your buying and selling as much as possible.
Undertaking Advanced Candlestick Analysis
“Candlestick charts” originated in the 1700s in Japan, when one man apparently discovered that there was a significant link between price and the supply and demand of rice. This led to the realization that the overall state of the market was influenced not only by the numbers, but also by the emotions of traders, economic and societal concern or stability, and more.
Eventually, these realizations resulted in visual aids to help identify what the market might be doing based on the observable factors. Over time, this has evolved into graphs and charts that are utilized in all types of trading markets.
Candlestick analysis can help traders observe regular patterns within the market so that they can more effectively forecast the direction and price of the market in the short term. While basic candlestick patterns can provide useful insights into the market, they can also end up creating false signals, and may not be as reliable as traders would like.
Advanced candlestick analysis involves utilising various techniques to hone the accuracy and reliability of candlestick analysis as a whole. This can involve viewing candlestick patterns in a more granular way that takes into consideration sub-patterns, such as “Island Reversal Patterns” and “Hook Reversal Patterns”.
Note: Aim for Simplicity Where Possible
While it’s extremely beneficial to utilise advanced and in-depth techniques such as advanced candlestick analysis in order to properly and effectively undertake price action trading, sometimes it’s important to remember that the simplest approach is frequently the best.
When charts are overloaded with extraneous information and data points that don’t relate directly to meaningful patterns in the market, you can end up drowning out your awareness and understanding of the market as a whole. Oftentimes, traders become so caught up in trying to analyze and parse the variables that their view of the fluctuations in the market becomes distorted.
Tracking support and resistance areas generally offer you the best understanding and are the key things that you should focus on when trying to hone your understanding of the market. It can quickly and easily become counterproductive to create and analyze too many charts that stray too far from the fundamentals.
What Exactly are Support and Resistance Areas?
First and foremost, support and resistance areas help you divide your financial charts up into “buying” and “selling” areas. Any area that sits above the current price point should be considered a “sell area” and any area that sits below the current price point is a “buy area”.
“Support areas” are “buy areas,” as buyers are found in these areas.
“Resistance areas” are “sell areas,” as sellers are found here.
It’s important to keep in mind that major market movers, such as hedge funds and banks, focus their orders on areas of support or resistance. What this means, in practice, is that every time the market price approaches a large sell area, a large number of sell orders will be triggered. In many cases, the result of this is that the price may quickly turn around and be ready for a full reversal.
Being able to react quickly and appropriately when price moves into support and resistance areas is therefore extremely important.
Why Do Market Movers Place Orders at Support and Resistance Areas?
Skilful traders tend not to be in the habit of randomly placing their orders and hoping for the best. Instead, they focus on placing their orders at significant price levels. While this makes sense, it’s also important to understand what “significant price levels” actually means. For most traders, these can come in a variety of forms, including annual highs or lows, all-time highs and lows, price stalls, price reversals, and more.
Market movers have a clear interest in trading this way. They have done in-depth analysis into the market trends over long periods of time, and understand the best times to buy and sell to maximize profits and minimize loss. Due to this, other traders in the market can expect that when prices hit certain support and resistance areas, they will see trends up or down. This is in no small part to the market movers.
Calculating and Placing Support and Resistance Areas
Many algorithms and indicators claim to provide a great overview of support and resistance areas. While these can definitely be beneficial, ultimately the most effective way of placing support and resistance areas on a graph may be to do it yourself, on the basis of your own observations.
Actually plotting out support and resistance areas on a graph tends to be quite a straightforward process. The “leg work” comes in the form of paying attention to developments in the market and placing lines on your graph wherever you notice two or more “bounces”.
Principles for Placing Support and Resistance Areas
In order to place support and resistance areas as accurately and reliably as possible, you should consider the following overall principles or “rules of thumb”.
- You should prioritise recent bounces on your graph over older bounces, as these will tend to give more insightful data on the current state and direction of market trends. Historical data can still be very useful, but may not be as directly relevant and applicable.
- Before placing a support and resistance area on your graph, you should have at least two connecting “bounces”. Some exceptions to this will apply, such as when you spot yearly or all-time highs and lows. Still, you want to be clear that the trend you’re observing is significant instead of just being “noise”.
- When placing support and resistance areas on your graph, you should place them on the body of your candle, as the body will be more relevant than the wick.
A Practical Approach to Placing Support and Resistance Areas
Here is the rough outline of a practical approach for placing support and resistance areas on your graph.
(1) Look at a chart that includes approximately one year of data and view it “zoomed out” to the one-year perspective. This will allow you to observe big-picture trends over this time period.
(2) Notice and mark out the highest and lowest bounces over the past year, and remember to place your areas at the bodies and not the wicks of these bounces. As you are observing data for a whole year, you can place highs and lows based on a single bounce, instead of a double bounce.
(3) Place your support and resistance areas on the graph by connecting areas that have two or more bounces.
Note: as a general rule of thumb, you should expect your yearly graph to contain between 5-8 support and resistance areas. If you have more than this, you’ve likely overshot and placed too many.
Important notes on Advanced Candlestick Analysis
Basic candlestick analysis is something that most new traders will learn about, at least to some degree. However, basic candlestick analysis often ends up not being very helpful for determining trends in the market.
Essentially this is because basic candlestick analysis is straightforward pattern recognition, which isn’t dynamic enough to account for the nature of the market in motion.
Candles are not just patterns
One issue with basic candlestick analysis is that they can end up leading people to focus on fixed definitions of particular patterns, viewed in isolation. However, the market doesn’t work in terms of abstract patterns occurring in isolation. Working according to fixed definitions can actually lead to losses and frustration in your trading.
Instead, candlesticks need to be observed and understood in relation to the other candlesticks around them. On top of this, there are a variety of other market factors that should be considered, as well, to find the most useful and insightful information.
Basic candlestick analysis is a fundamental and helpful tool, especially for those just starting to learn Forex trading. However, make sure that you don’t fall into the trap of focusing only on basic candlestick analysis without supporting information and context.
Indecision Candles Are Important to Keep in Mind
“Indecision candles” refer to candlestick patterns where neither buyers nor sellers are in a position to gain, or hold onto, control of the market price.
Indecision candles are quite common, and can be frustrating to navigate at first, but are also a useful signal to pay attention to.
An indecision candle could include the following features:
- A large upper wick, indicating that buyers tried to continue a trend but failed, as sellers pushed the price down
- A small “bearish” body, showing that sellers were able to close lower than the open, indicating that buyers are losing power.
- A small lower wick, indicating that sellers weren’t strong enough to turn the price around completely, but were able to stall further movement in the buyers’ direction.
Indecision candles, in particular, need to be understood in the context of surrounding trends and movements, or else they can stall your ability to make effective decisions.